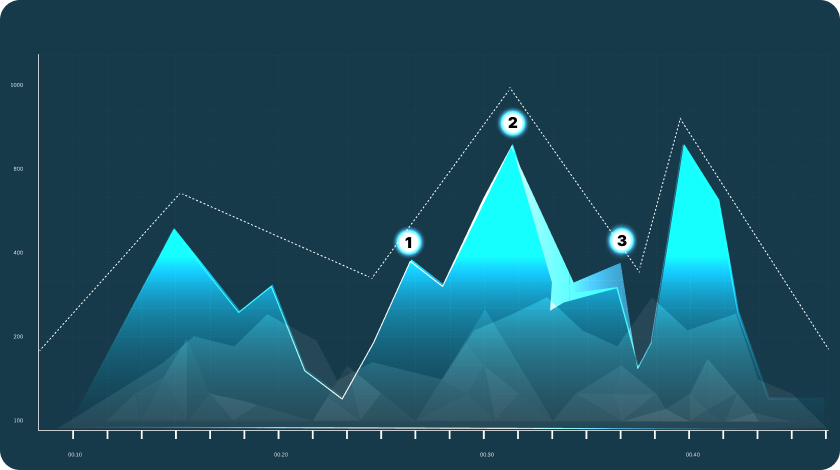
Thousands of experienced investors and traders daily use the head and shoulders model to forecast possible trend reversals in financial markets, particularly in currencies, stocks, and commodities. Three main peaks of this tool form a distinctive shape resembling a human head and shoulders.
So, traders must always understand how to interpret the head and shoulders pattern to foresee market movements and make knowledgeable decisions. So, what is head and shoulder pattern? Let us figure it out.
Who invented the head and shoulder chart?
Actually, the head and shoulders pattern wasn’t invented by a single person. It developed over time through observations of various types of market behavior. Its main principles were formulated by practitioners.
The pattern’s first documented usage dates back to the early 20th century. It gained prominence as a key tool for chartists and traders who desired to recognize potential trend reversals.
Over the years, adaptations and refinements have been made to the interpretation and application of the head and shoulders pattern.
This contributed to its continuing relevance in various sorts of contemporary trading strategies.
Key features of this tool
According to prominent financial experts and experienced traders, the head and shoulders pattern has the following significant features:
1.Trend reversal signal
This signal is mainly strong when the pattern forms after a prolonged trend. So, a potential reversal to a downtrend may occur.
2.Distinctive shape
This model consists of three main peaks. The central peak is called the head. It is always higher than the two surrounding peaks, which are called the shoulders.
This shape resembles a human head and shoulders and is easily recognizable on price charts. For example, in an uptrend, prices reach a high (left shoulder), pull back, then reach a higher high (head), pull back again, and finally reach a third high (right shoulder) before declining.
3.Neckline confirmation
It is a trend line that generally connects the lows of the two troughs between the peaks of the head and shoulders.
A decisive break below this neckline confirms the strength of the pattern. It always serves as a trigger for traders to enter short positions.
For instance, if prices break the neckline when they have already formed the right shoulder, it confirms the head and shoulders pattern.
4.Price target
In many cases, traders utilize the height of the pattern. They do it to guesstimate a price target for the following move after the breakout.
For example, if the head-to-neckline distance is $20, and the breakout occurs at $110, the price target would be $90 ($110 – $20). So, it indicates a potential decline to that level.
5.Volume analysis
Volume analysis is vital in confirming the strength of the pattern. Volume tends to lessen as the pattern develops and confirms its significance.
For instance, a breakout below the neckline accompanied by high volume boosts the overall trustworthiness of the pattern.
Positives and negatives of this pattern
As with any other tool for technical analysis, this one has its positives and negatives. Hence, financial analysts distinguish the most common ones. Please, get familiar with the list below.
Advantages
- Patterns always integrate volume analysis for extra confirmation.
- This tool provides a clear chart representation of trend reversal.
- This instrument can be used across various financial markets.
- Confirmation through neckline break adds trustworthiness to signals.
- It helps traders foresee potential entry/exit points.
- This tool facilitates risk management through distinct stop-loss levels.
- Patterns provide a structured approach to technical analysis.
- It allows for the setting of price targets based on pattern height.
- This pattern works well together with other technical indicators.
Drawbacks
- Sporadic failure to reach price targets.
- In some cases, patterns may be prejudiced and open to interpretation.
- Breakouts sometimes may lack follow-through, which may result in whipsaws.
- Patterns may take time to develop, which often leads to missed opportunities.
- Overreliance on the pattern without considering the overall market context can be harmful.
- False signals may happen, which always leads to probable losses.
Final words
When you master the significant head and shoulder pattern stock, you will undoubtedly get a priceless edge in dealing with all the complexities of financial markets. For example, you can successfully utilize MyForexVPS for traders.
Consequently, if you need trustworthy hardware with uppermost security and minimal risk of disruptions, VPS will be your perfect choice.
However, like any analysis tool, the head and shoulders pattern should be used together with other risk management techniques.
Hence, continual observation, practice, and enhancement of analytical skills are vital for effectively incorporating this pattern into various trading strategies.


